Michael Belli
Insurance Marketing Analytics Decision Engine
This is a self-directed demonstration project. It walks an end-to-end analytics workflow for a B2C insurance company — from exploratory analysis through predictive modeling to budget optimization and business-impact measurement — to show how I approach the work.
Note on the data: Everything here runs on a synthetic dataset I generated to mirror realistic insurance-marketing dynamics. The figures throughout are outputs of that simulation, included to illustrate the methodology end to end — not results from a client engagement.
The Business Problem
In insurance, growth without risk discipline destroys value. Marketing teams optimize for lead volume and cost-per-lead, but cheap leads often become unprofitable policies. This project works through three questions:
- Which marketing channels drive profitable growth—not just volume?
- How do we model the diminishing returns of marketing spend?
- Where should we reallocate budget to maximize lifetime value?
1. Exploratory Data Analysis
|
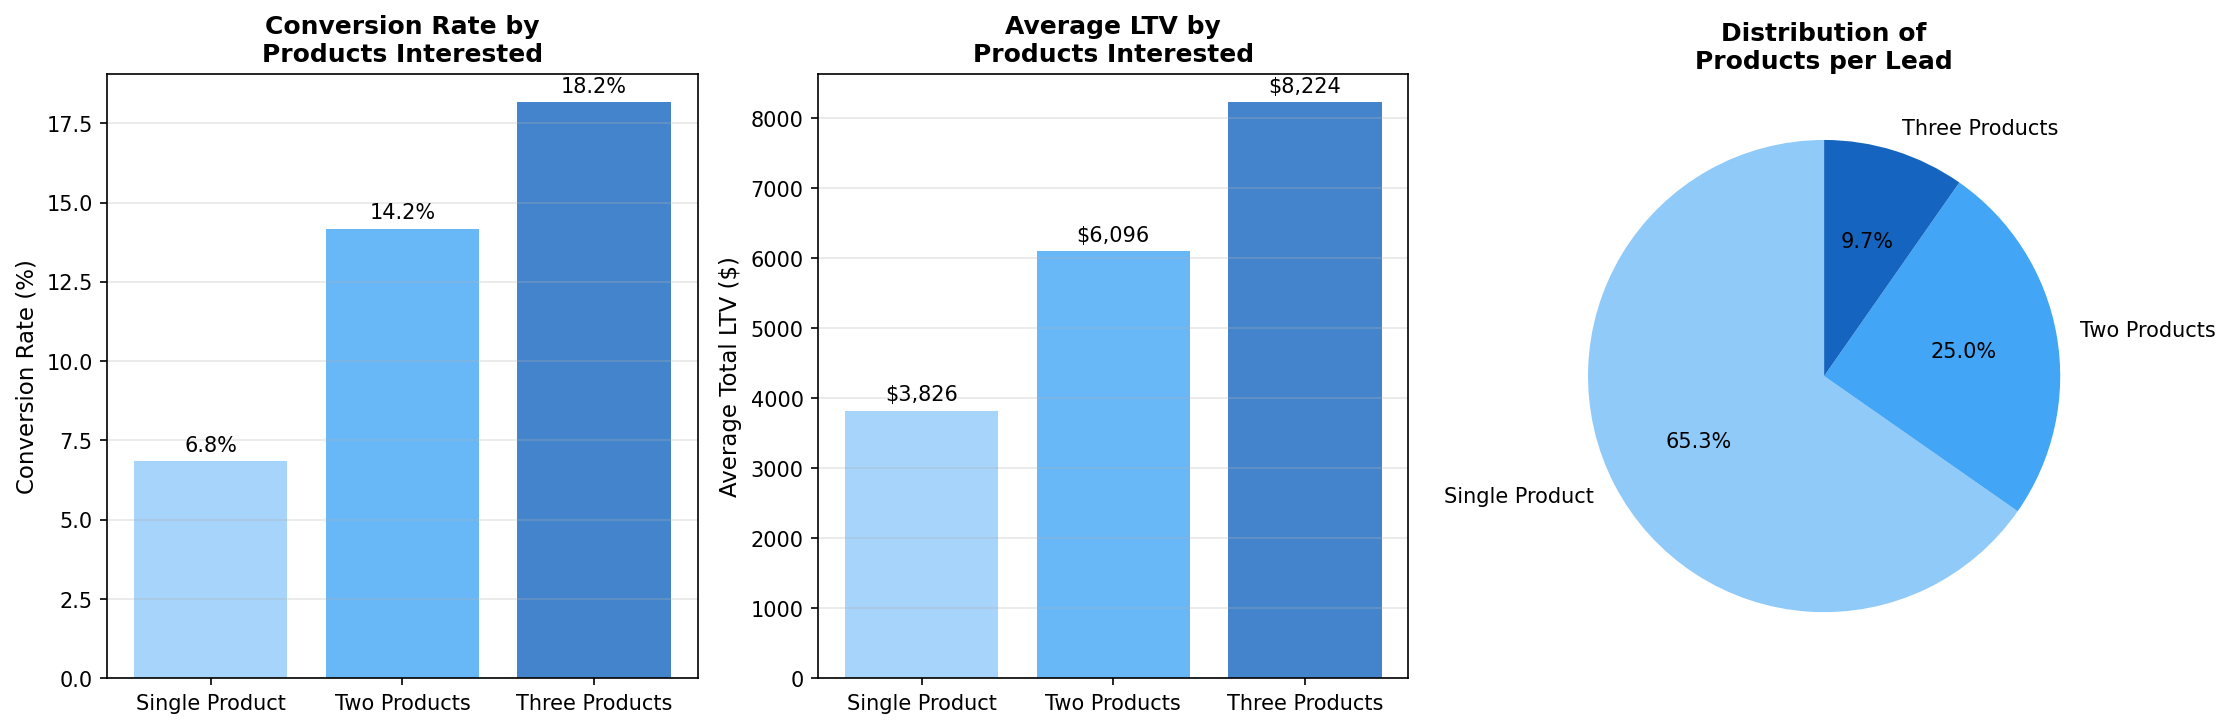
Eight exploratory analyses reveal the key dynamics of insurance marketing:
The EDA surfaces the core insight: email has the highest ROI despite the lowest lead quality, because its acquisition cost ($8/lead) is dramatically lower than paid search ($45/lead). |
 Click for details
|
2. Marketing Mix Model
|
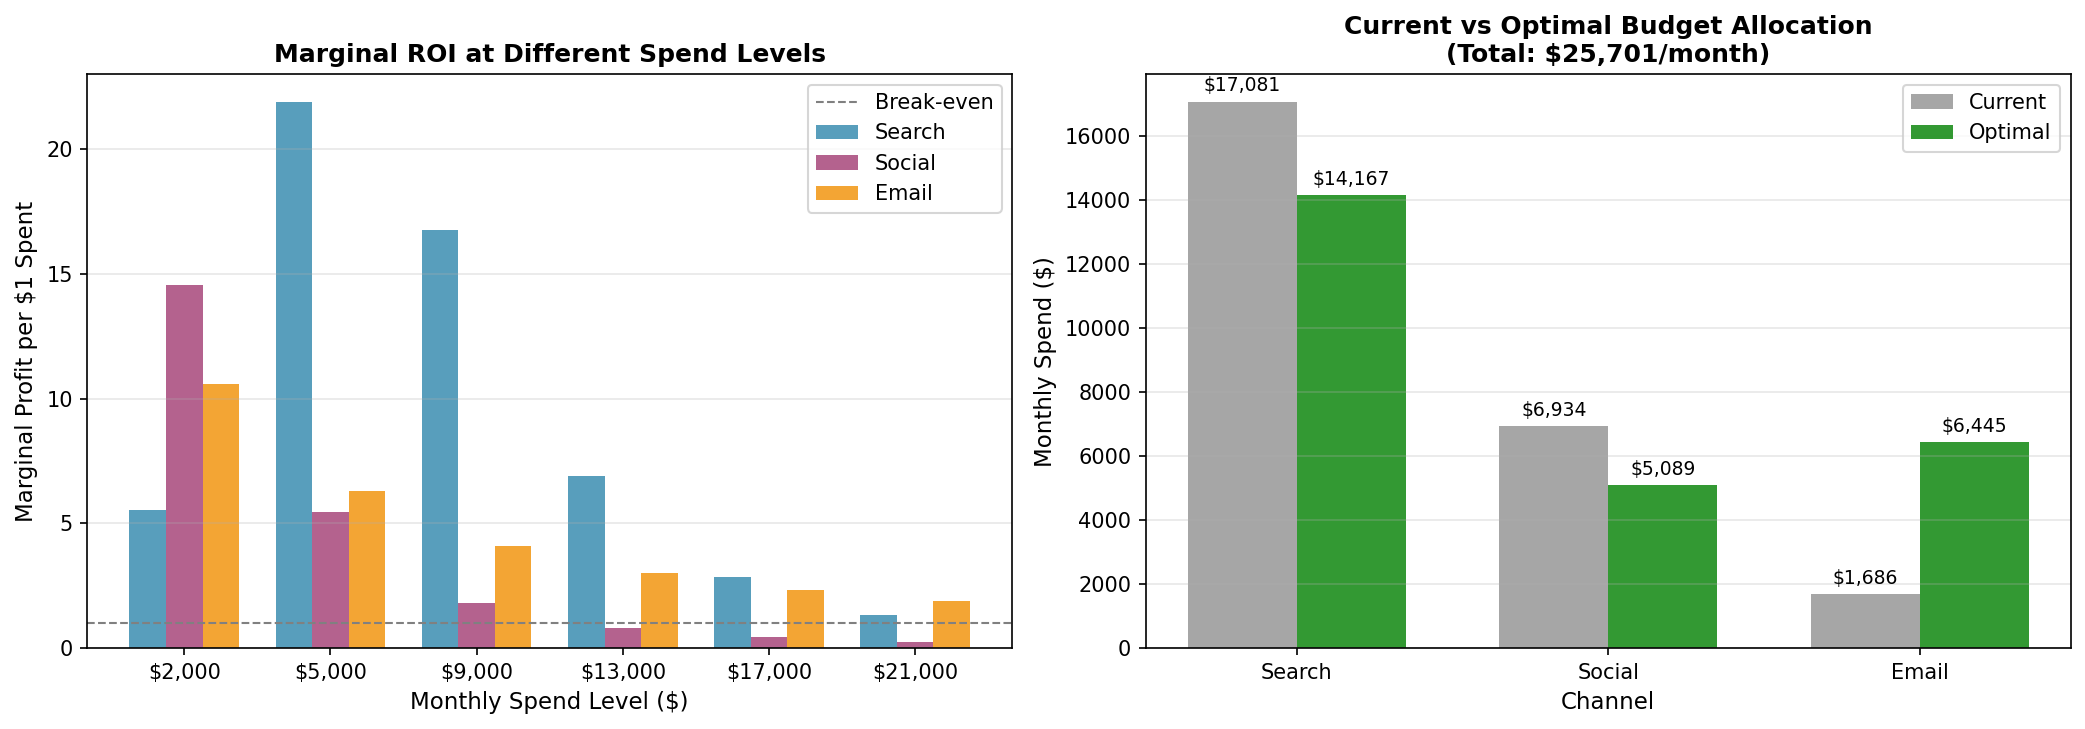
The Marketing Mix Model (MMM) quantifies the relationship between spend and conversions using Hill saturation curves:
The model reveals that email is operating at just 8% of its half-saturation point—significant room to scale—while search and social are both near 70%. |
 Click for details
|
3. Budget Optimization
|
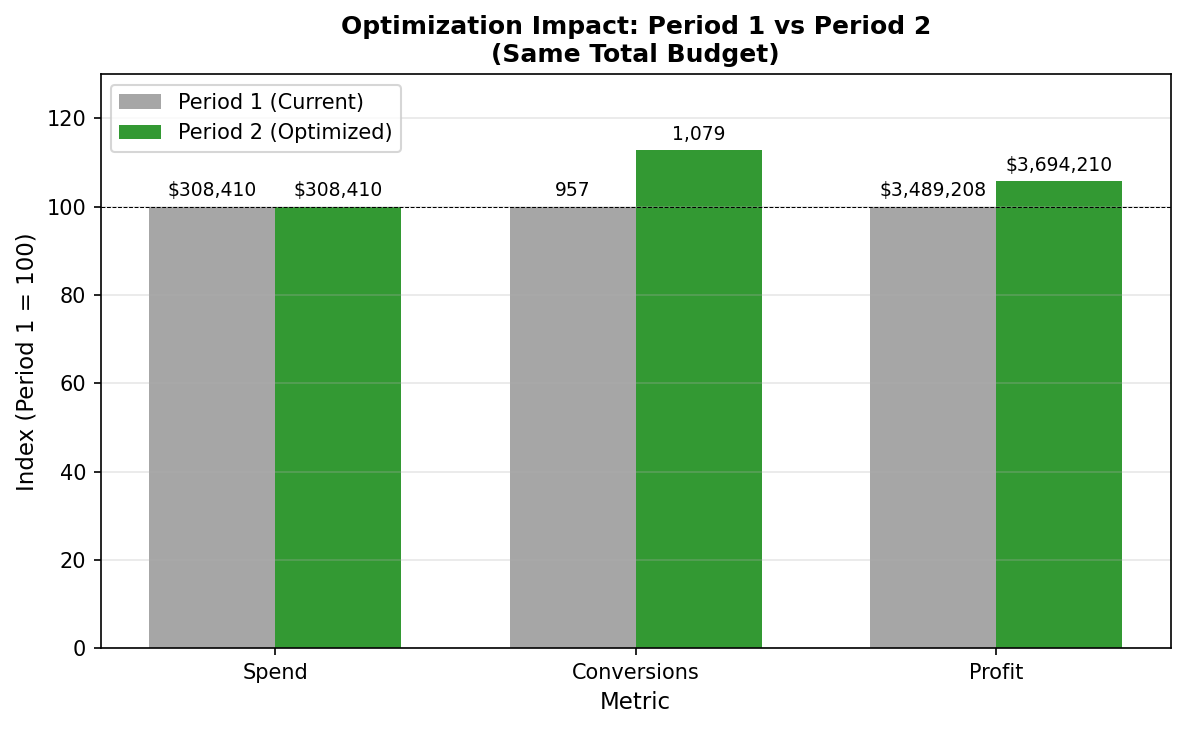
Using the fitted response curves, we simulate two scenarios:
With the same total marketing spend, the optimal allocation shifts ~$4,800/month out of search and social into under-saturated email, yielding:
|
 Click to enlarge
|
4. Business Impact
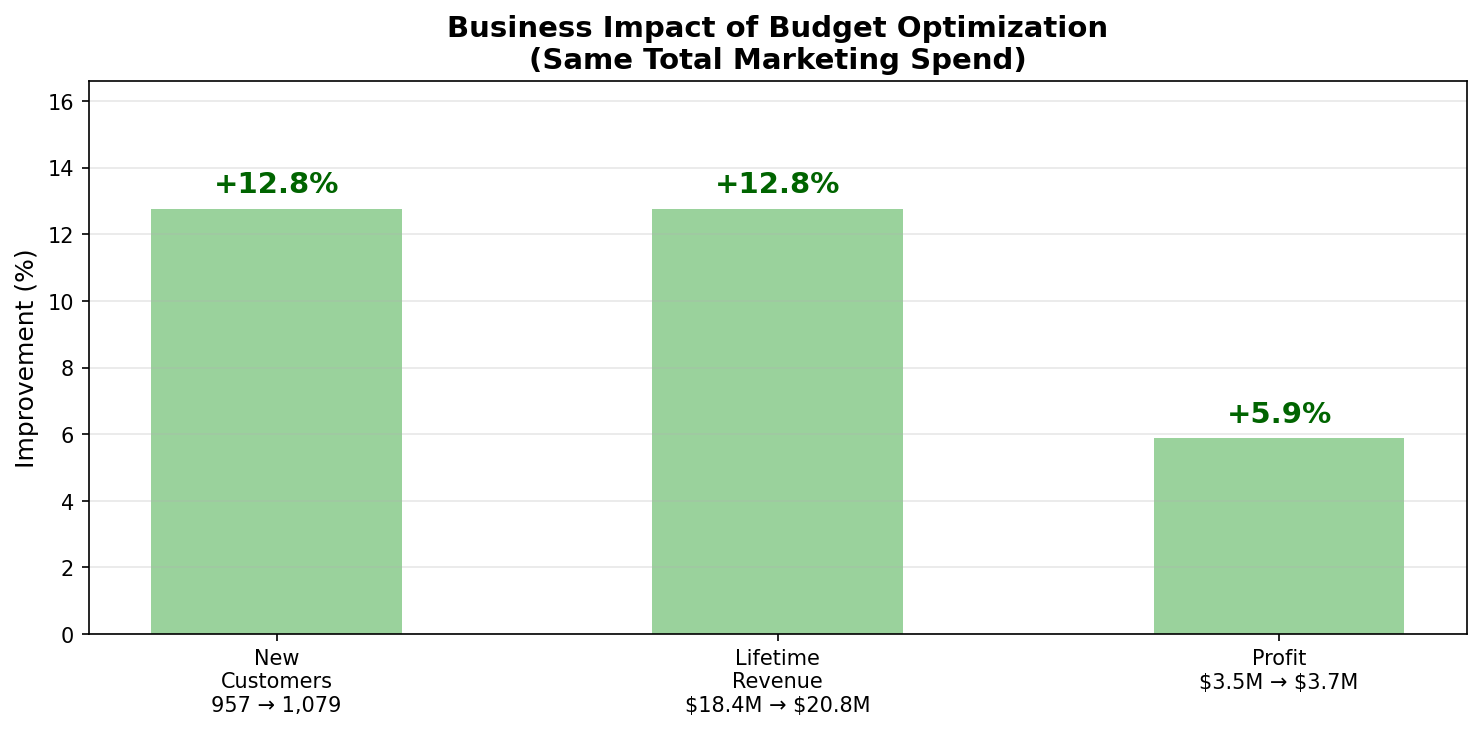
Within the simulation, reallocating the same modeled $308K annual marketing budget produces:
| Metric | Before | After | Change |
|---|---|---|---|
| New Customers | 957 | 1,079 | +12.8% |
| Lifetime Revenue | $18.4M | $20.8M | +$2.4M |
| Policy Profit | $3.49M | $3.69M | +$205K |
| CAC | $322 | $286 | -11% |
(Profit rises far less than conversions because the reallocation leans into email — high ROI on acquisition cost, but lower-margin policies. Surfacing that trade-off is exactly the point of the model.)
Technical Implementation
Data Generation: Python script creating synthetic but realistic insurance marketing data with:
- 3 years of lead data across 3 products (Health, Life, Property/Casualty)
- 3 marketing channels with quality/cost trade-offs, where daily spend varies widely (budget regimes and experiments) and leads follow a saturating response to spend
- Full sales funnel with claims simulation, plus cross-sell dynamics (bundled customers convert better and retain longer)
Modeling: Hill saturation functions with an ROI-based constraint, fit on monthly-aggregated data using nonlinear least squares.
Optimization: Profit-maximizing budget allocation using scipy.optimize.