Michael Belli
Exploratory Data Analysis
This page presents eight exploratory analyses that reveal the key dynamics of insurance marketing. Each analysis surfaces insights that inform the marketing mix model and budget optimization.
1. Credit Score Impact on Conversion and Loss Ratio
|
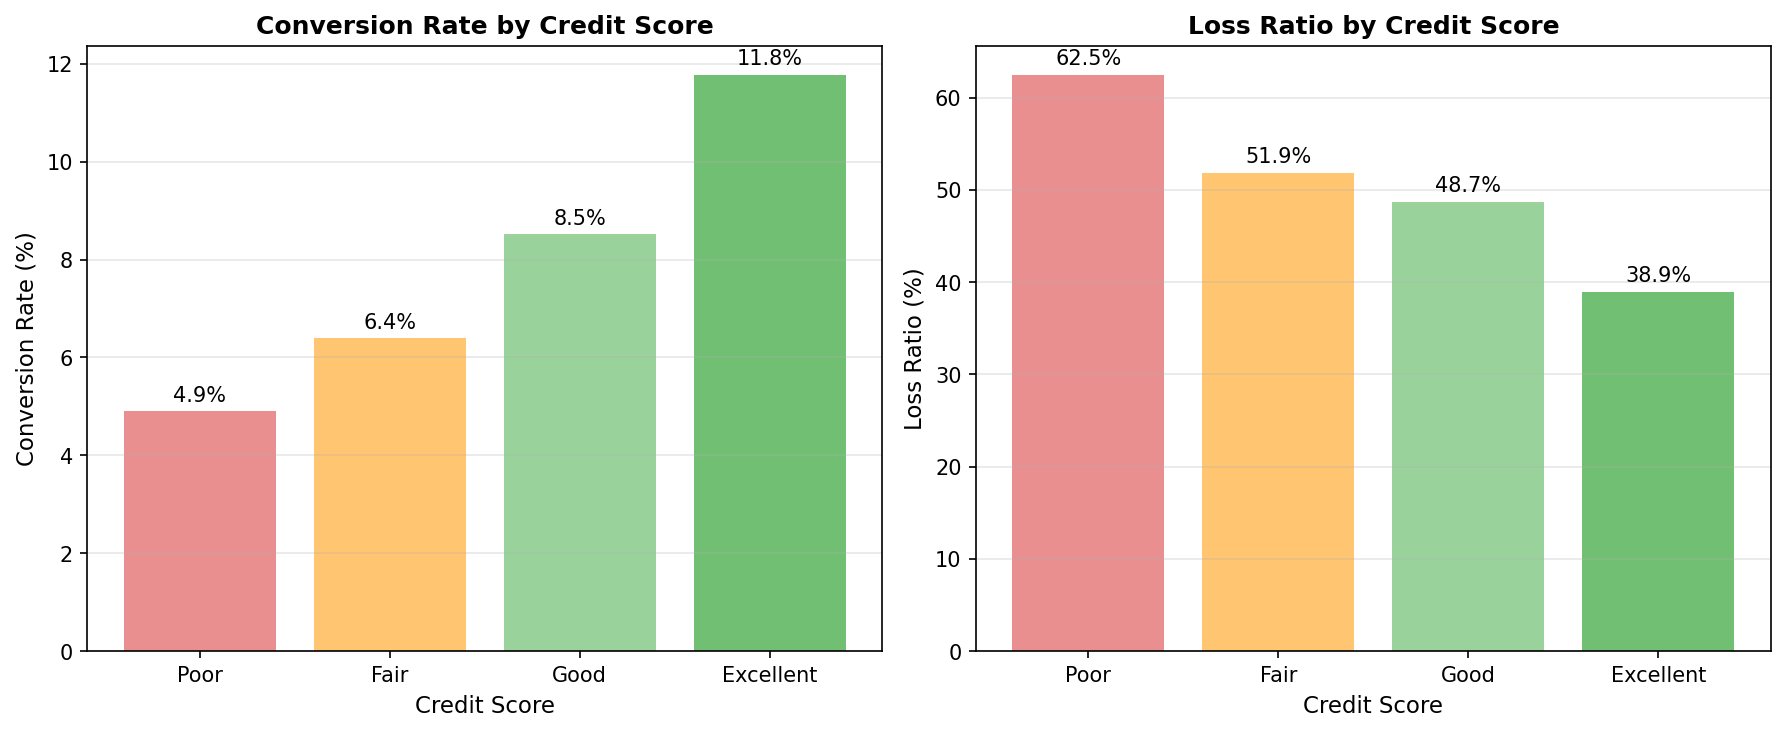
Credit-based insurance scores are a major underwriting tool. This analysis validates that better credit correlates with both higher conversion rates AND lower claims. Key Finding: Excellent credit customers convert at ~2.4x the rate of Poor credit (11.8% vs 4.9%), with loss ratios 23 percentage points lower (0.39 vs 0.62). Implication: Credit score should inform lead prioritization, not just pricing. |
|
2. Optimal Age Bands by Product
|
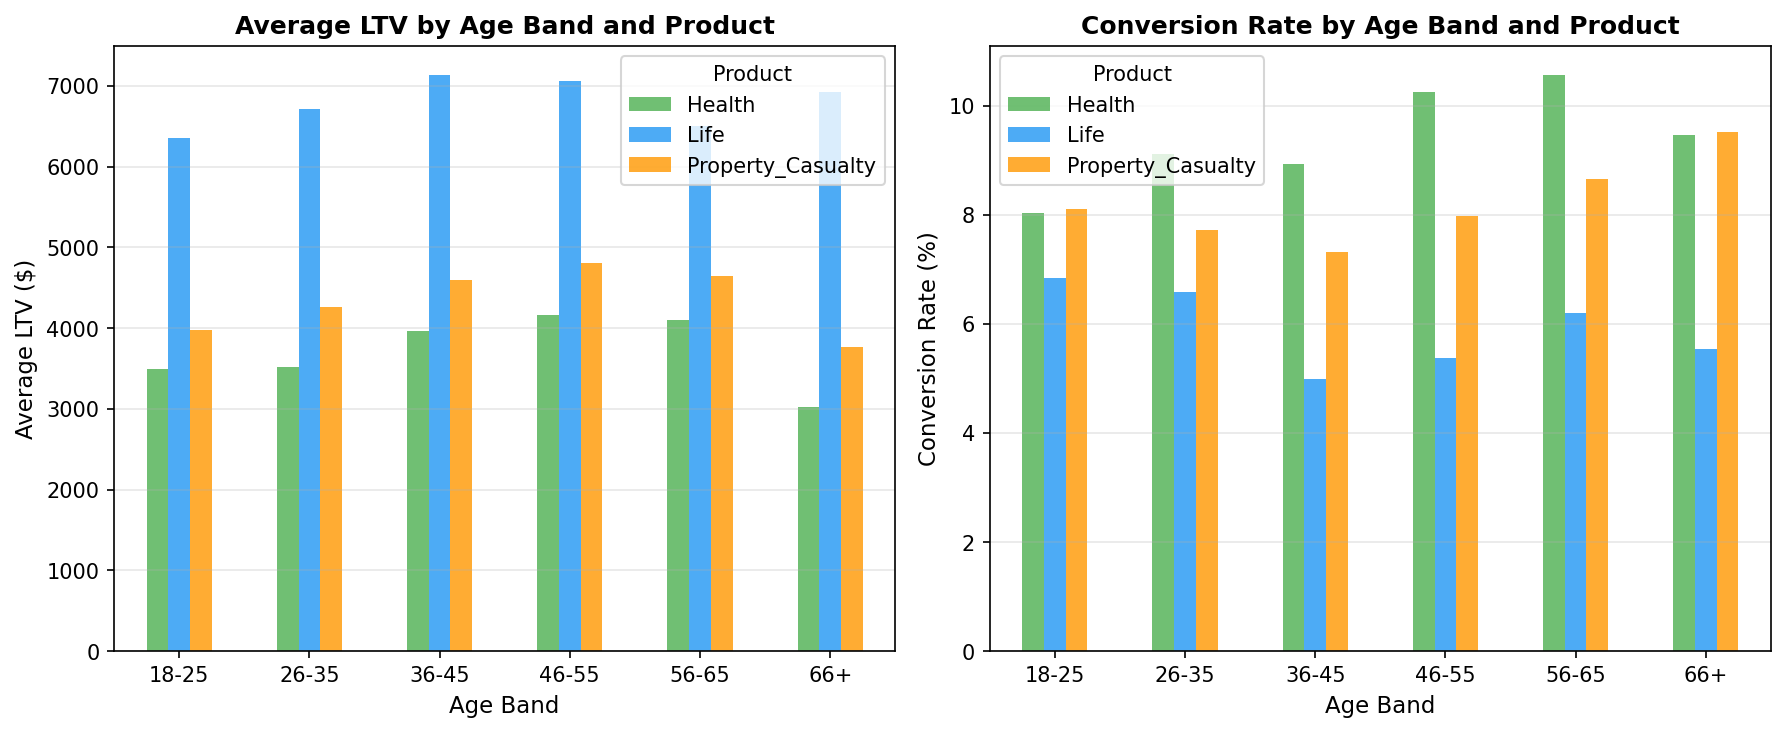
Age is the primary rating variable in life and health insurance. The optimal customer age differs by product line. Key Finding:
Implication: One-size-fits-all age targeting leaves value on the table. |
|
3. Cross-Sell and Multi-Product Opportunity
|
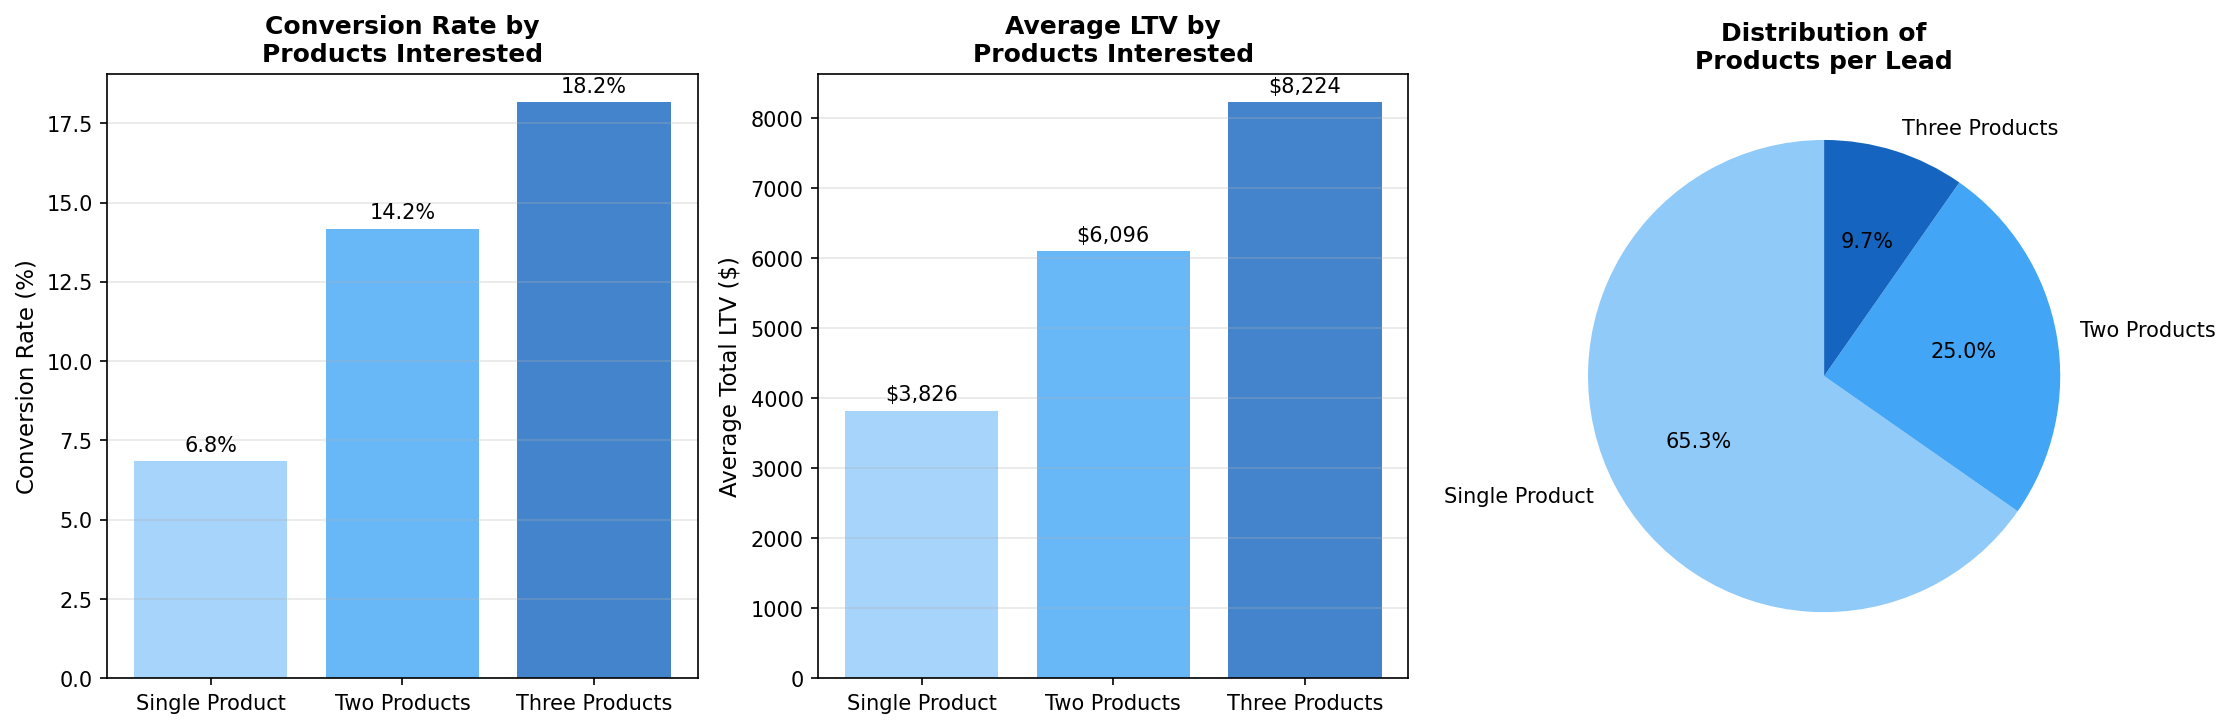
Bundled customers retain roughly twice as long (~90% vs ~80% annual retention). This analysis quantifies the cross-sell opportunity. Key Finding: Multi-product leads convert ~2x better (14.2% vs 6.8% for two-product vs single), and customers who actually bundle retain ~2x longer and carry ~2x the lifetime value ($6,096 vs $3,826). Implication: Invest in cross-sell programs—bundling lifts both conversion and retention. |
|
4. Geographic Performance Variation
|
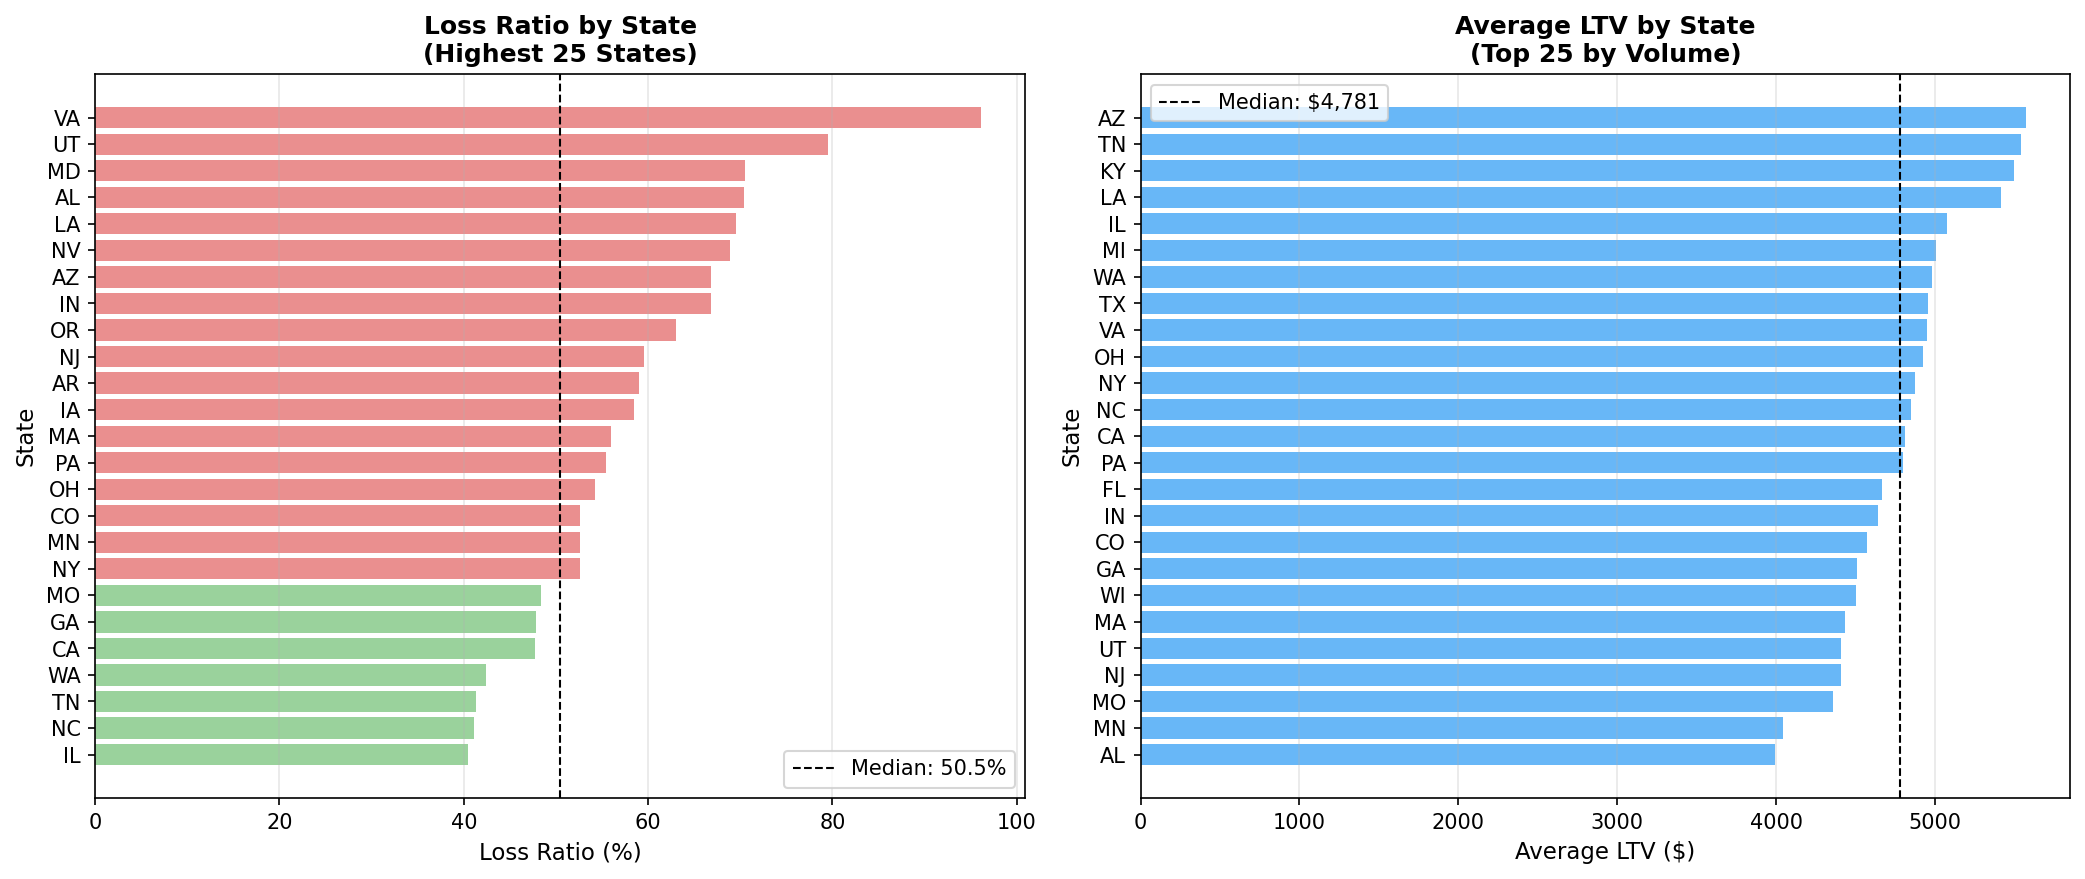
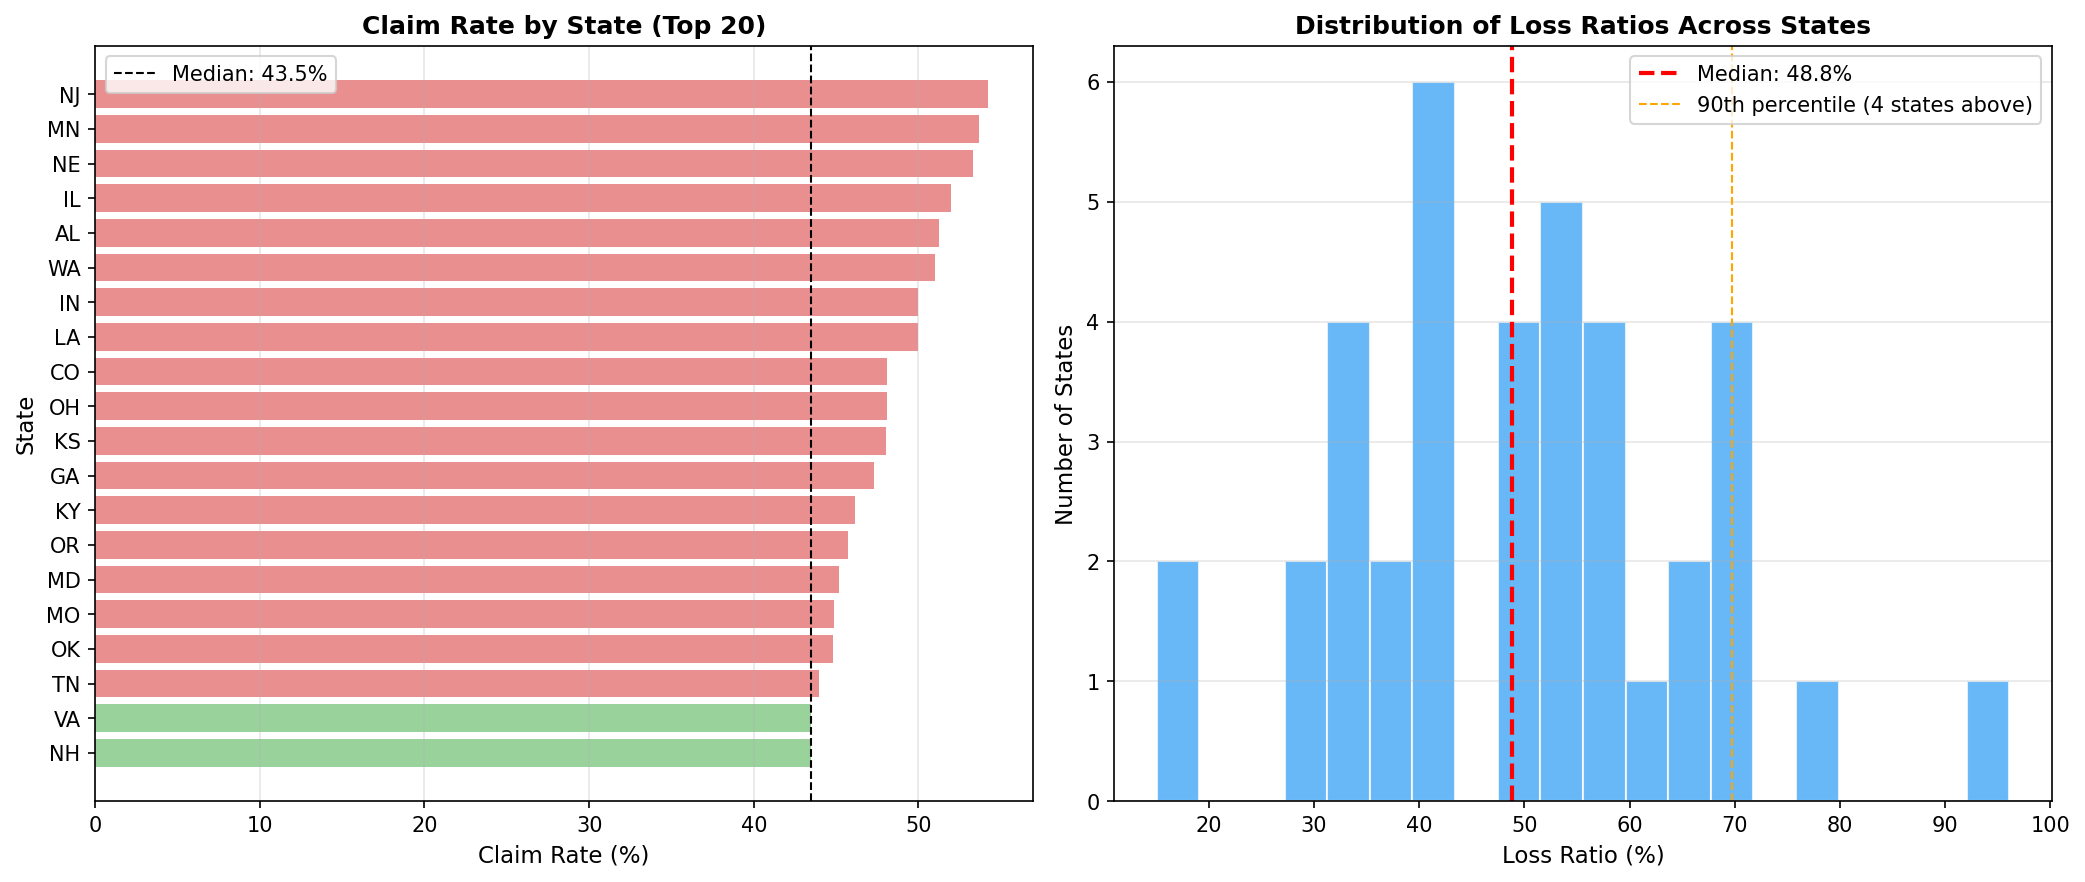
Insurance is state-regulated—each state has different rate approval processes, coverage mandates, and competitive dynamics. Key Finding: Loss ratios vary significantly by state, from ~15% to ~96%. Implication: Geographic risk pricing and targeted underwriting are essential. The highest-loss states should be addressed immediately. |
|
5. Adverse Selection by Marketing Channel
|
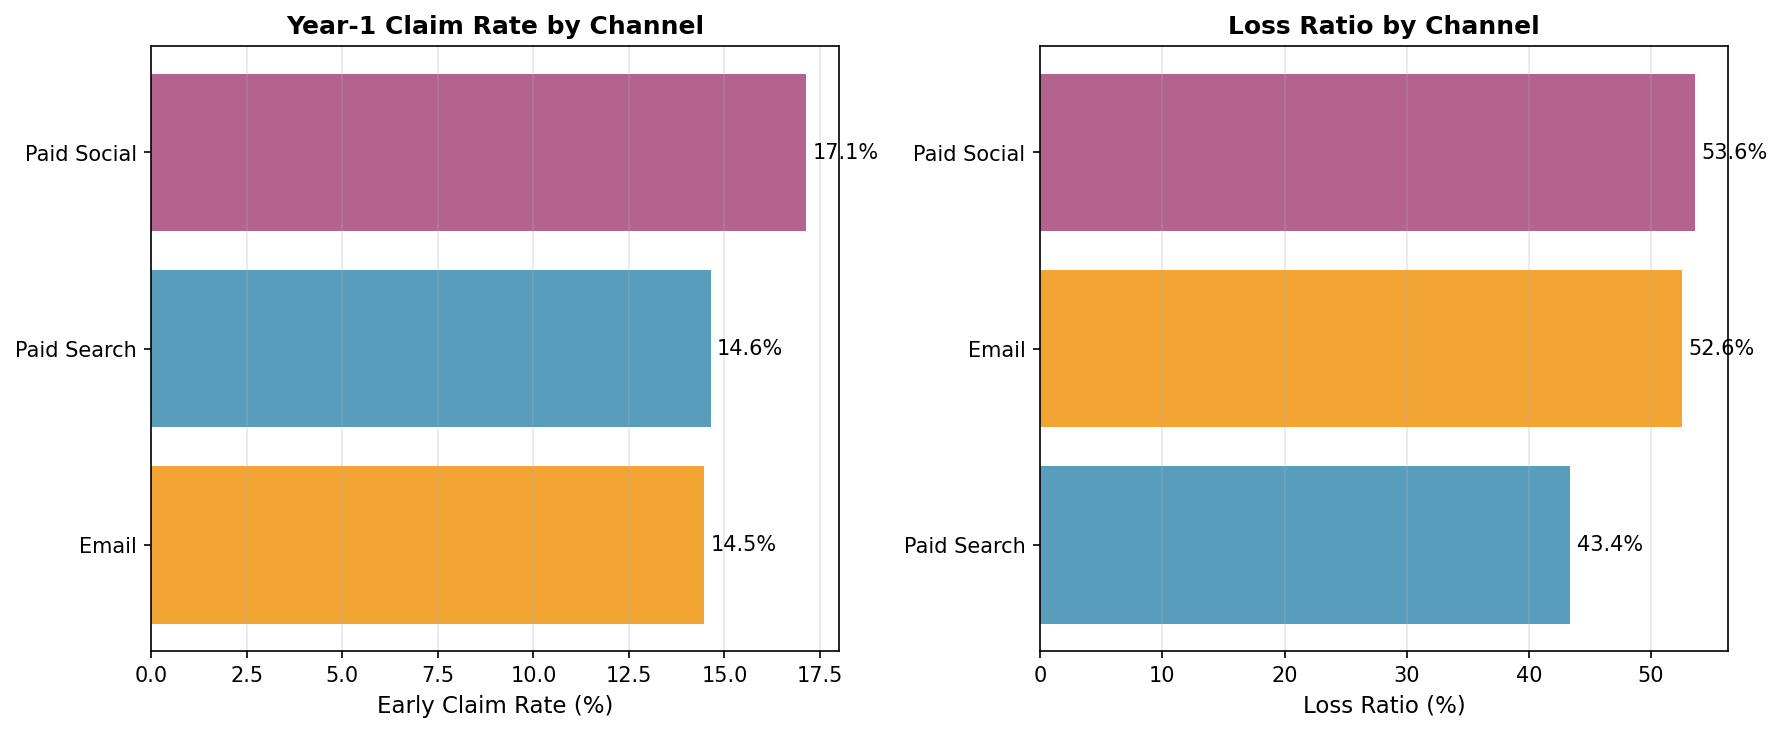
Cheaper acquisition channels are designed to attract marginally higher-risk customers. This analysis looks for that adverse-selection effect. Key Finding: The effect is real but modest and partly masked by product mix. Holding product constant, the cheapest channel does carry more risk—within Health, email policies have a higher early-claim rate than search (29.7% vs 26.3%)—but at the aggregate level the channel signal is small relative to product-driven claims and sampling noise. Implication: Any channel-level risk adjustment should be applied within product, not on raw channel averages. |
|
6. Marketing ROI by Channel
|
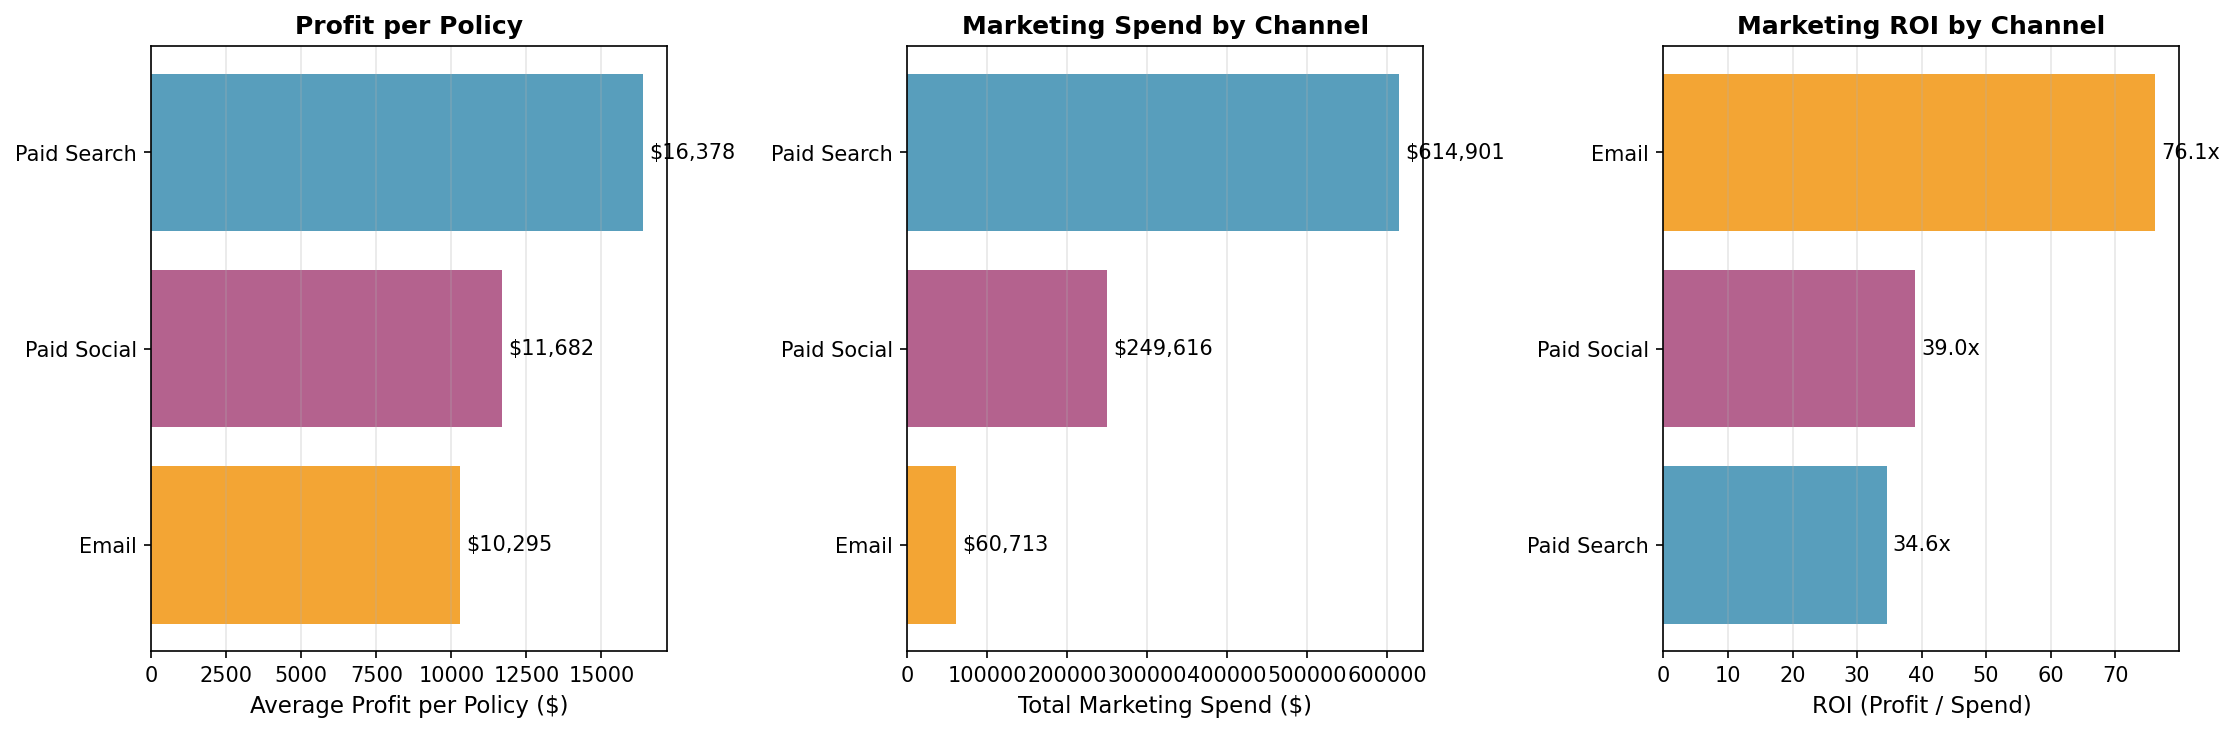
What matters for budget allocation is profit per marketing dollar, not profit per policy. A channel with lower profit per policy can still be better if acquisition costs are low enough. Key Finding: Email earns the highest ROI (~17.9x, roughly 2x search and social) despite lower profit per policy, because its acquisition cost ($8/lead) is far below paid search ($45/lead). Implication: Shift budget toward email to maximize total profit. |
|
7. State-Level Claims and Loss Ratios
|
Identifying geographic risk concentration to inform pricing and underwriting decisions. Key Finding: Loss ratios span ~15% to ~96% across states, concentrating risk in a handful of states that warrant rate increases or stricter underwriting. Implication: State-level performance monitoring should be routine. |
|
8. Bind Rate vs. Claims Rate Trade-off
|
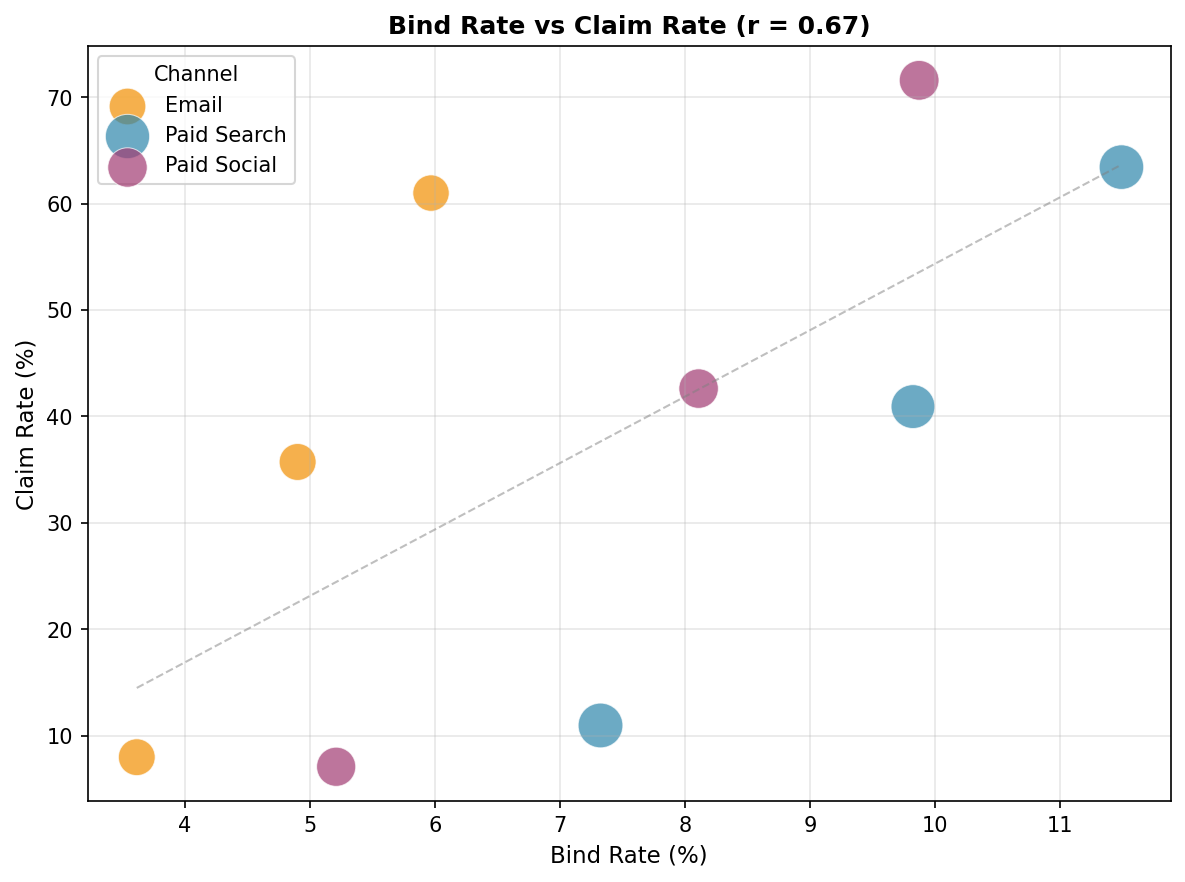
Do higher-converting channels produce riskier policies? This tests the quality-quantity trade-off. Key Finding: A positive correlation (r=0.67) across channel-product segments confirms that segments which bind aggressively also carry more claims—driven by Health, which both converts best and claims most. Implication: Conversion optimization must be balanced against underwriting quality. |
|
Summary of Insights
| Analysis | Key Finding | Action |
|---|---|---|
| Credit Score | Excellent converts ~2.4x Poor, loss ratio 23 pts lower | Prioritize high-credit leads |
| Age Bands | LTV peaks ages 35–55, varies by product | Product-specific targeting |
| Cross-Sell | ~2x conversion, LTV, and retention for bundled | Invest in bundling |
| Geographic | Loss ratios 15%–96% across states | State-level rate adequacy |
| Adverse Selection | Real but modest; visible only within product | Risk-adjust within product |
| Channel ROI | Email ~17.9x ROI, ~2x search and social | Shift budget to email |
| State Claims | Risk concentrated in a few high-loss states | Underwriting review |
| Bind vs Claims | r=0.67 across channel-product segments | Balance volume vs quality |
| ← Back to Home | Next: Marketing Mix Model → |