Michael Belli
Marketing Mix Model
This page documents the Marketing Mix Model (MMM) that quantifies the relationship between marketing spend and customer conversions, enabling data-driven budget optimization.
Model Overview
|
The model uses a two-stage approach:
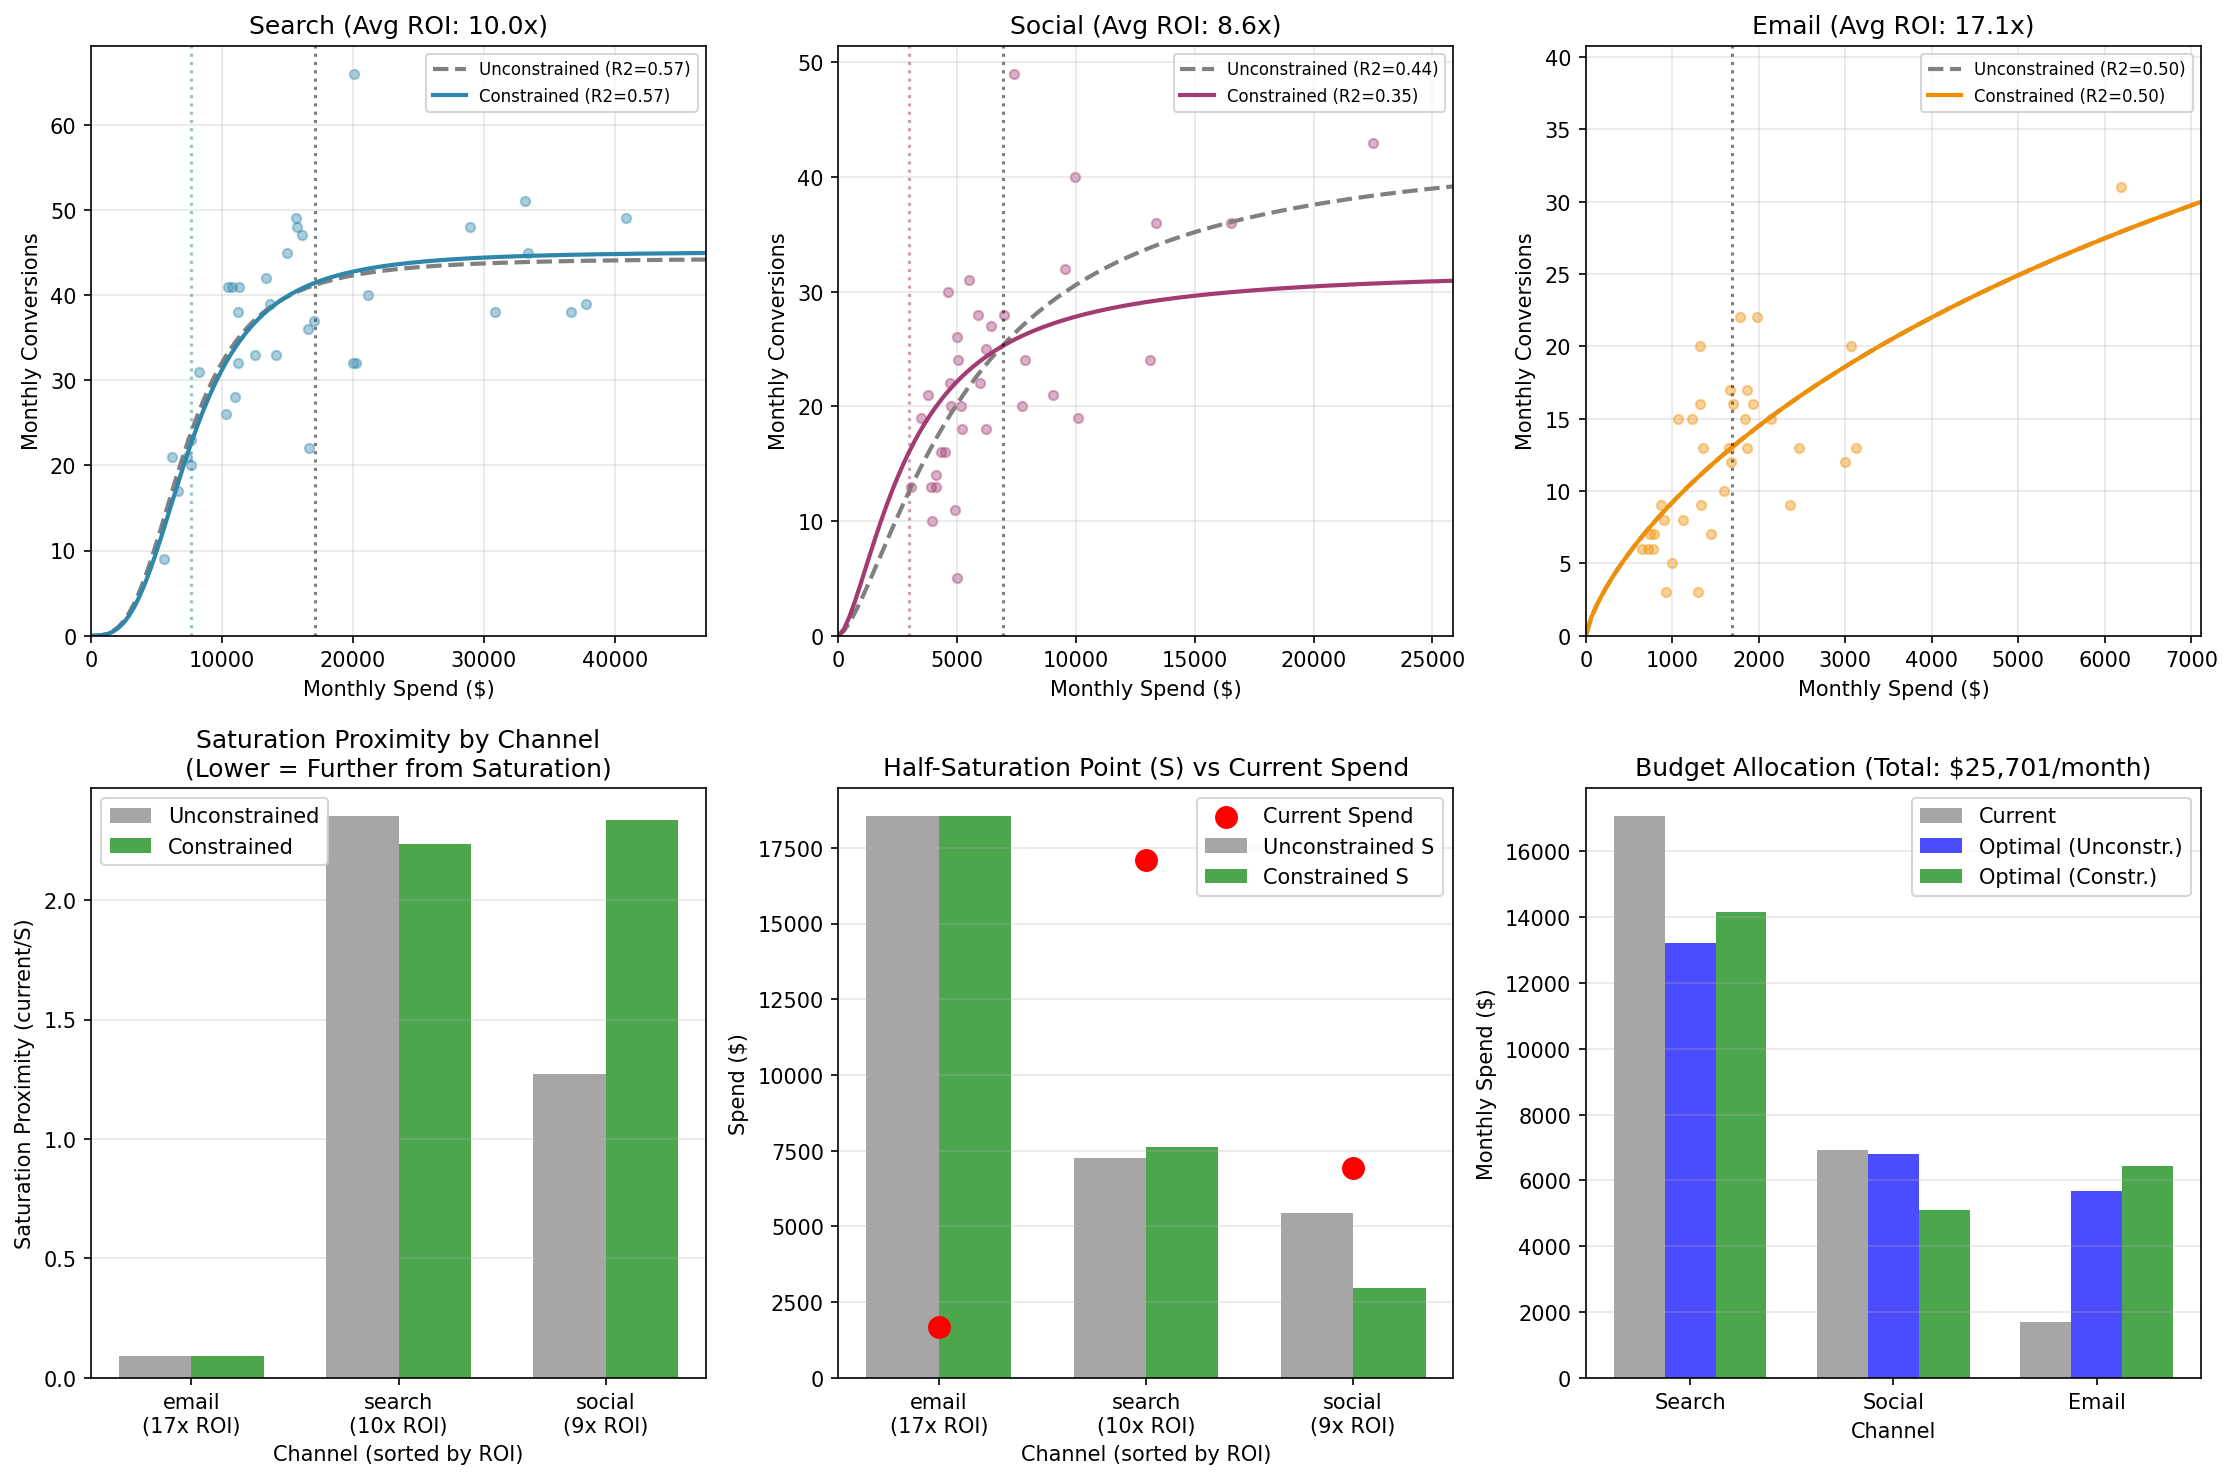
This separation produces tighter fits because the spend→conversions relationship is more direct than spend→profit (which includes claim variance). Model Fit (R², monthly):
|
 Click to enlarge
|
The Hill Saturation Function
Marketing spend exhibits diminishing returns—each additional dollar produces less than the last—and eventually saturates—there’s a ceiling on what a channel can deliver.
The Hill function captures both:
Conversions(Spend) = K × Spend^β / (S^β + Spend^β)
Parameters:
- K = Maximum conversions per month (saturation ceiling)
- S = Half-saturation point (spend at which conversions = K/2)
- β = Shape parameter (steepness of the curve)
Economic Assumptions
Profit is calculated as NPV of policy cash flows, not gross margin:
| Assumption | Value | Rationale |
|---|---|---|
| Expense ratio | 30% | Operating costs as % of premium |
| Discount rate | 10% | Time value of money |
Annual profit = Annual premium × (1 - 0.30) - Annual claims
NPV = Annual profit × Annuity factor(10%, tenure)
ROI-Saturation Constraint
A key innovation: the model enforces that higher-ROI channels are further from saturation.
Intuition: If a channel has high average ROI, it’s likely because we’re operating on the steep part of the response curve (far from saturation). Low average ROI suggests we’re already in diminishing returns.
Constraint:
If ROI_i > ROI_j, then (Spend_i / S_i) < (Spend_j / S_j)
This prevents the model from incorrectly concluding that high-ROI channels are “saturated” when we simply haven’t tested higher spend levels.
In this dataset the constraint is largely confirmatory: because spend varies widely enough to identify the curves, the unconstrained fit already orders the channels consistently with their ROI (email least saturated, search/social most). The constraint barely moves the result—so it functions as a robustness check rather than doing the heavy lifting, which is exactly what you want.
Fitted Parameters
| Channel | K (Max Conv/mo) | S (Half-Sat) | β | % of Saturation | Avg Profit/Conv |
|---|---|---|---|---|---|
| 91 | $18,552 | 0.75 | 8% (far) | $2,318 | |
| Social | 32 | $2,967 | 1.56 | 70% (near) | $2,561 |
| Search | 45 | $7,637 | 3.00 | 69% (near) | $4,727 |
Interpretation:
- Email is at just 8% of saturation—significant room to scale, and it carries the highest ROI
- Search and Social are both near 70% of saturation—approaching diminishing returns
Optimal Budget Allocation
Given the fitted curves, the optimal allocation equalizes marginal profit across channels:
| Channel | Current | Optimal | Change |
|---|---|---|---|
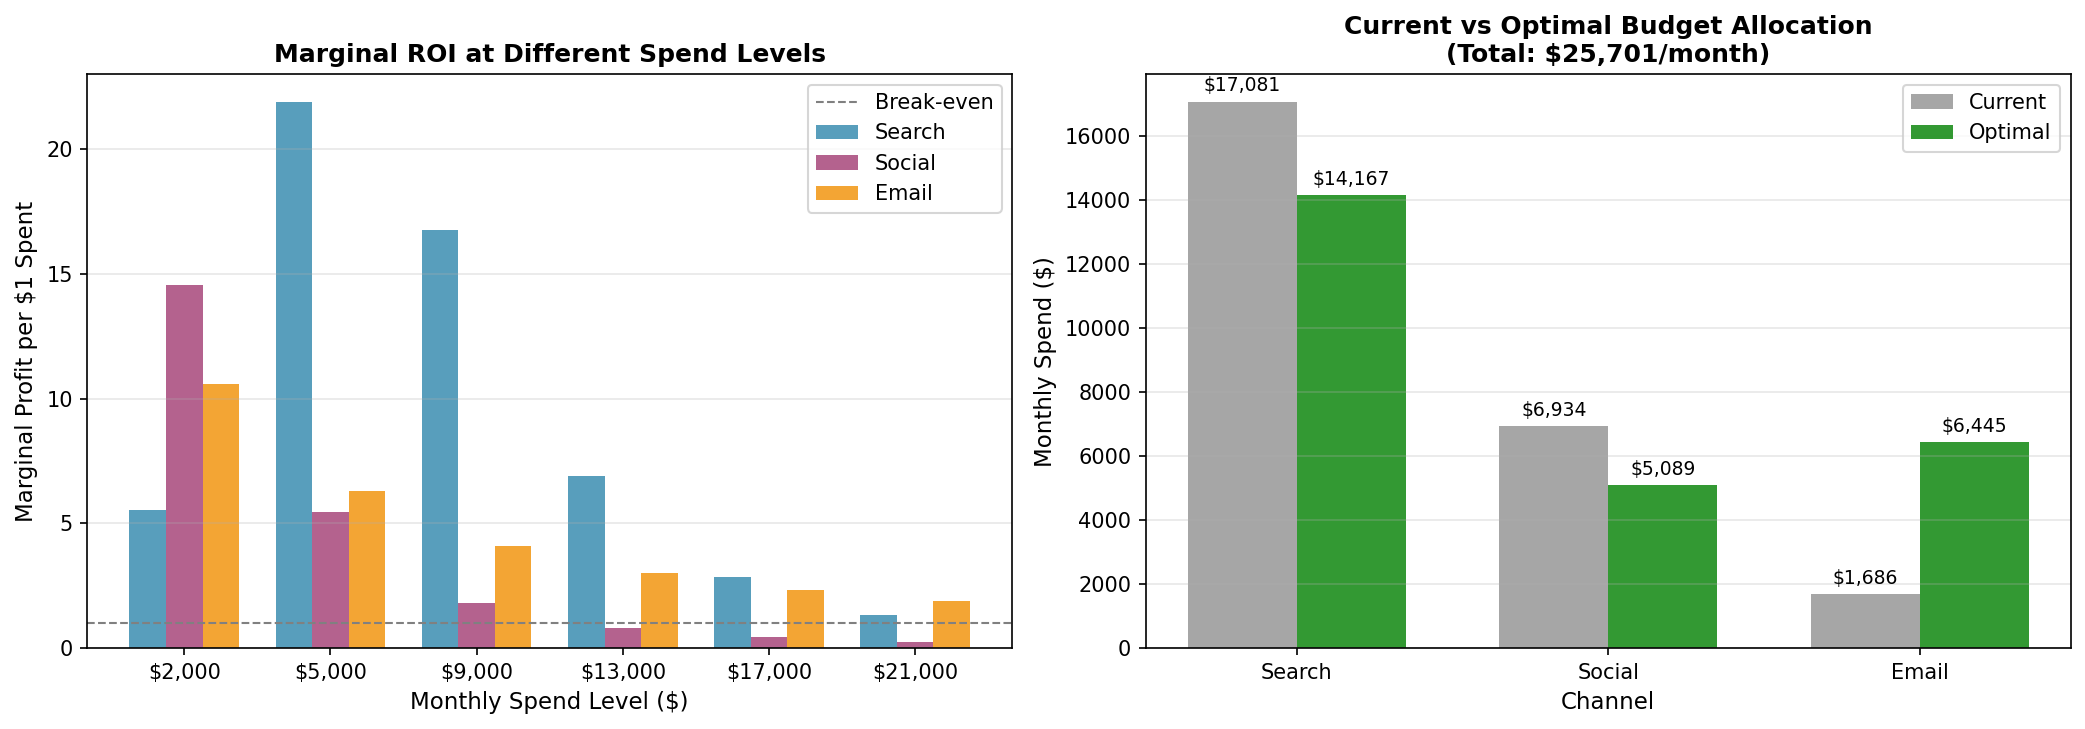
| Search | $17,081/mo | $14,167/mo | -$2,914 |
| Social | $6,934/mo | $5,089/mo | -$1,845 |
| $1,686/mo | $6,445/mo | +$4,759 |
The optimization shifts ~$4,800/month out of search and social (both near saturation) into email (far from saturation, highest ROI).
Model Limitations
-
Extrapolated ceiling for under-saturated channels: Email operates far below its half-saturation point, so its saturation ceiling is inferred from a limited set of high-spend observations rather than directly measured.
-
No carryover effects: Assumes spend in month N only affects conversions in month N. Brand effects and delayed conversions are ignored.
-
No interaction effects: Channels are modeled independently. In reality, search and social may reinforce each other.
-
Monthly aggregation: Fitting on monthly data stabilizes the curves (and damps weekly count noise) but leaves only 36 observations per channel, so parameter estimates carry meaningful uncertainty.
Files
| File | Description |
|---|---|
MMM/marketing_mix_model.py |
Main model code |
MMM/constrained_comparison.png |
Response curves visualization |
MMM/MMM_homepage.png |
Summary chart for homepage |
MMM/constrained_results.json |
Fitted parameters |
MMM/constrained_report.txt |
Full text report |
| ← Back to Home | Previous: EDA | Next: Optimization → |