Michael Belli
Budget Optimization
This page documents the budget optimization simulation that compares current allocation (Period 1) to optimal allocation (Period 2).
Optimization Approach
|
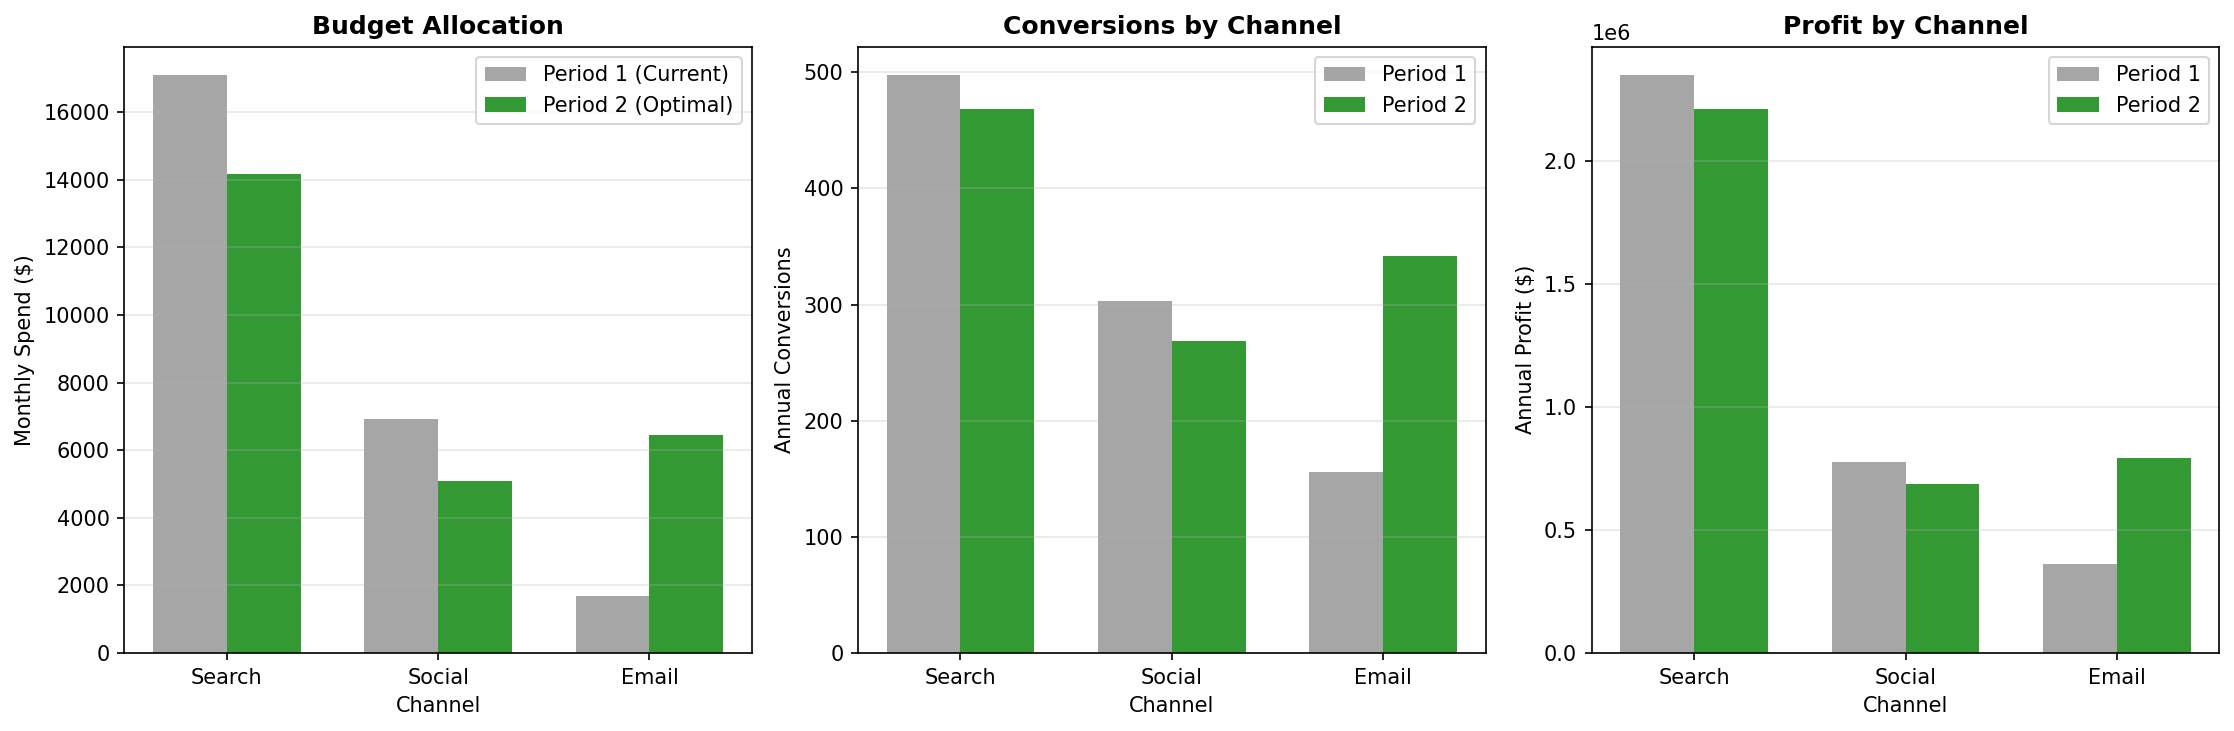
Using the fitted response curves from the Marketing Mix Model, we simulate two scenarios at the monthly budget level: Period 1 (Current): Historical budget allocation
Period 2 (Optimal): Budget reallocated to equalize marginal ROI
|
 Click to enlarge
|
Simulation Results
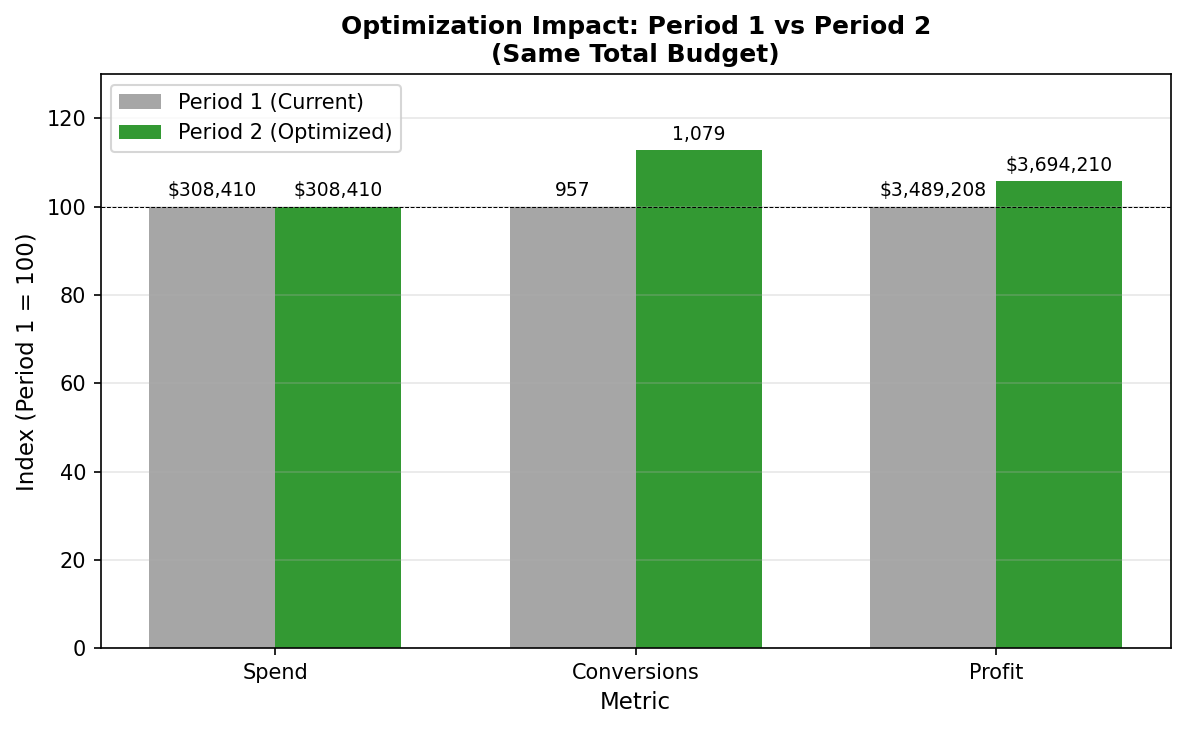
| Metric | Period 1 (Current) | Period 2 (Optimal) | Change |
|---|---|---|---|
| Marketing Spend | $308,410 | $308,410 | $0 |
| Conversions | 957 | 1,079 | +122 (+12.8%) |
| Profit | $3,489,208 | $3,694,210 | +$205,002 (+5.9%) |
| ROI | 11.3x | 12.0x | +0.7x |
Why Does Reallocation Work?
The optimization works because marginal ROI varies across channels, depending on where each one sits on its response curve:
- Email ($1,686/mo) sits at just 8% of saturation—on the steep part of its curve, so each additional dollar still buys strong incremental conversions (highest average ROI, 17.9x).
- Search ($17,081/mo) and Social ($6,934/mo) are both near 70% of saturation—on the flattening part of their curves, so additional spend returns progressively less.
Moving dollars out of the near-saturated channels (search, social) into under-saturated email captures more conversions per dollar.
Channel-Level Impact
Email (Increased from $1,686 to $6,445/month)
| Metric | Period 1 | Period 2 | Change |
|---|---|---|---|
| Annual Spend | $20,238 | $77,342 | +$57,104 |
| Conversions | 156 | 342 | +186 |
| Profit | $361,863 | $793,154 | +$431,291 |
| ROI | 17.9x | 10.3x | -7.6x |
Email’s ROI decreases as we spend more (diminishing returns), but it remains strongly profitable even at ~4x the spend—which is exactly why it absorbs most of the reallocated budget.
Social (Decreased from $6,934 to $5,089/month)
| Metric | Period 1 | Period 2 | Change |
|---|---|---|---|
| Annual Spend | $83,205 | $61,070 | -$22,135 |
| Conversions | 303 | 268 | -35 |
| Profit | $776,990 | $687,400 | -$89,590 |
| ROI | 9.3x | 11.3x | +2.0x |
Social’s ROI increases as we spend less (moving back up the curve), but we reallocate those dollars to a higher-opportunity channel.
Search (Decreased from $17,081 to $14,167/month)
| Metric | Period 1 | Period 2 | Change |
|---|---|---|---|
| Annual Spend | $204,967 | $169,998 | -$34,969 |
| Conversions | 497 | 468 | -29 |
| Profit | $2,350,355 | $2,213,656 | -$136,699 |
| ROI | 11.5x | 13.0x | +1.5x |
Search is the most-saturated channel, so trimming its spend costs few conversions while its ROI improves—freeing budget for email.
Optimization Theory
The optimal allocation satisfies the equi-marginal principle:
At optimum, the marginal profit per dollar is equal across all channels.
If marginal ROI were higher for one channel, we could improve total profit by shifting a dollar from a lower-marginal-ROI channel to it.
At the optimal allocation, the marginal profit from one more dollar is equalized across email, social, and search—no further reallocation can improve total profit.
Caveats
-
Model uncertainty: The response curves are fit on 36 monthly observations and carry estimation error, especially email’s saturation ceiling, which sits well above its observed spend.
-
Extrapolation risk: Email is currently at very low spend levels. The model extrapolates its performance at ~4x higher spend.
-
Execution factors: Can email volume actually scale 4x? Are there list fatigue effects?
-
Competitive response: Competitors may respond to our channel shifts.
Recommendation: Implement the reallocation gradually and monitor for saturation signals (declining conversion rates, rising CPL).
Files
| File | Description |
|---|---|
Optimization/optimize_budget.py |
Simulation code |
Optimization/optimization_comparison.png |
Channel-level comparison |
Optimization/Optimization_homepage.png |
Summary chart |
Optimization/optimization_results.json |
Simulation results |
| ← Back to Home | Previous: MMM | Next: Business Impact → |