Michael Belli
Direct Mail Targeting: Mail Less, Make More
A self-contained simulation of a high-value direct-mail acquisition program showing what a targeting model is actually worth in dollars. A universe of 100,000 prospect households is scored, ranked into deciles, and mailed only where the expected incremental sales cover the postage. The result: 40% fewer pieces, $22K more profit, and ROI up from 45% to 102% — on the same file, with the same economics.
The point is not that models predict well. The point is that a decile ranking converts a prediction into a stopping rule: it tells you exactly where in the file to stop mailing, and prices out what every decile below the line would have lost.
Note on the data: The dataset is simulated from a known data-generating process, seeded for exact reproducibility. Working from a known ground truth means the economics can be checked end-to-end — the model has to rediscover the response pattern from mailed outcomes alone, exactly as it would in a live program.
Interactive version of this page →
The Setup
A high-value acquisition program: each sale is worth $1,000, each mail piece costs $1.50. The file has 100,000 prospect households with four attributes a list vendor would realistically supply: income, net worth, a modeled cruise-ship likelihood, and prior direct-mail response frequency.
Two design choices mirror real programs:
- A random 10% holdout receives no mail. Some households buy without being mailed, so raw response overstates what mail causes. The holdout pins down the baseline: mail lifts response roughly 5x here, meaning about a sixth of “mailed sales” would have happened anyway.
- The model only sees what a real analyst sees. The true response propensity is hidden inside the data-generating process. A logistic regression is trained on the mailed households’ outcomes, then scores every household — including the holdout — into deciles (decile 1 = best 10%).
Without a model, you mail all ~90,000 non-holdout households. With one, you mail only the deciles that pay.
What the Model Finds
| The trained model separates the file sharply: the top decile responds at 0.75%, eleven times the bottom decile’s 0.07%. The dashed line is breakeven — the response rate at which incremental sales just cover mail cost, about 0.18% at these economics. Deciles 1–6 clear it. Deciles 7–10 lose money on every piece mailed. | 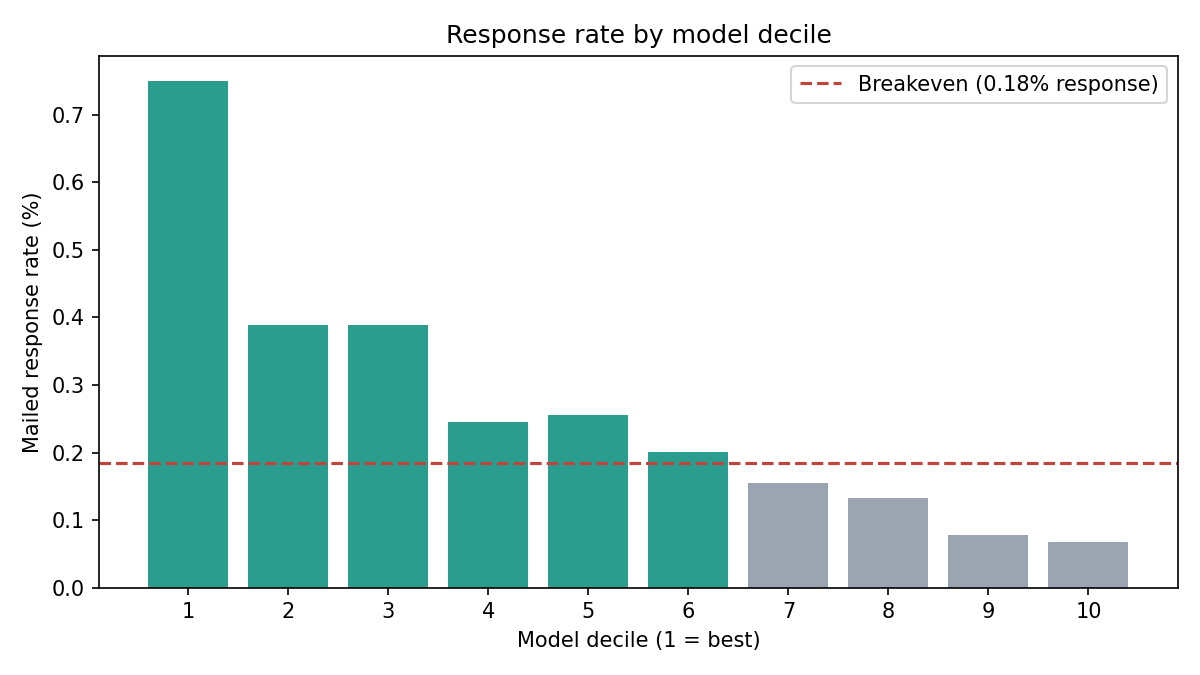 Mailed response rate by model decile, with the breakeven line. Click to enlarge. |
| — | — |
Mailed response rate by model decile, with the breakeven line. Click to enlarge. |
| — | — |
| Translating each decile into dollars — incremental sales value minus mail cost — makes the stopping rule visible. The top decile alone contributes $41K net; each of the bottom four destroys $2K–$9K. Mailing decile 10 costs $13,449 in postage to generate about $4,900 in incremental value. | 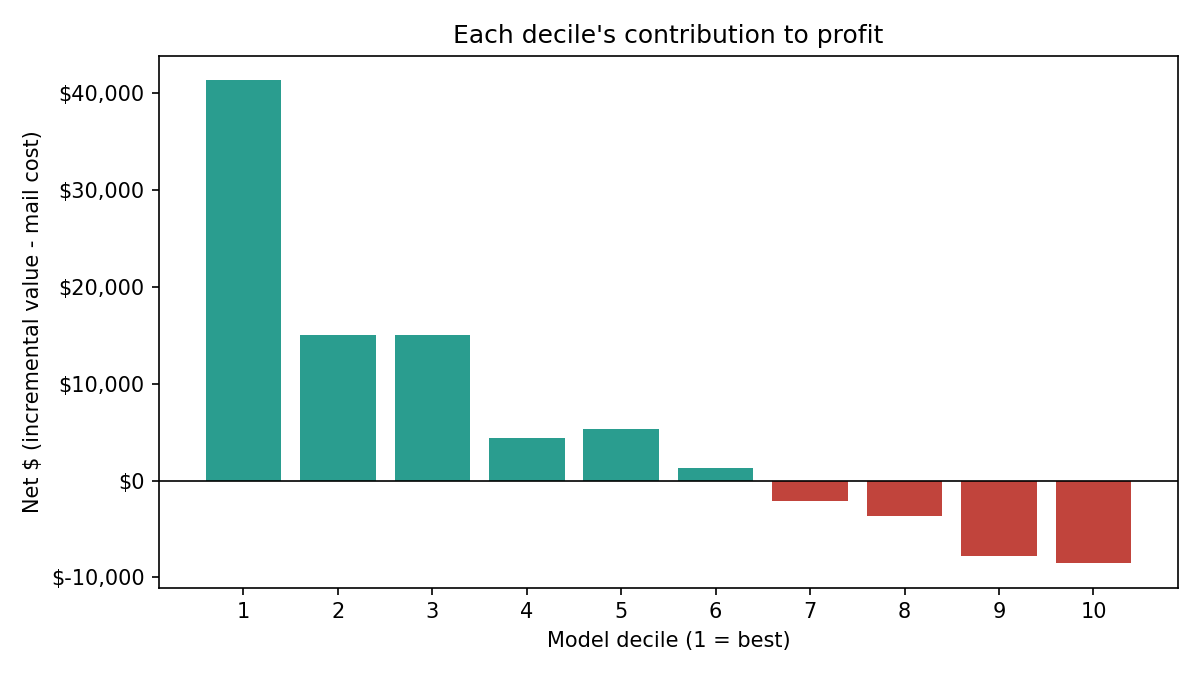 Each decile’s net contribution. Green pays; red is postage burned. Click to enlarge. |
| — | — |
Each decile’s net contribution. Green pays; red is postage burned. Click to enlarge. |
| — | — |
The Bottom Line
| Scenario | Pieces | Mailed sales | Incremental sales | Mail cost | Net | ROI |
|---|---|---|---|---|---|---|
| No model — mail everyone | 89,806 | 239 | 195 | $134,709 | $60,191 | 45% |
| With model — mail deciles 1–6 | 53,841 | 200 | 163 | $80,762 | $82,338 | 102% |
Mailing six deciles instead of ten gives up 32 incremental sales in the bottom four deciles — sales that cost more in postage than they returned. In exchange: 35,965 fewer pieces, $22,147 more net profit, and ROI more than doubled, while keeping 84% of the incremental sales.
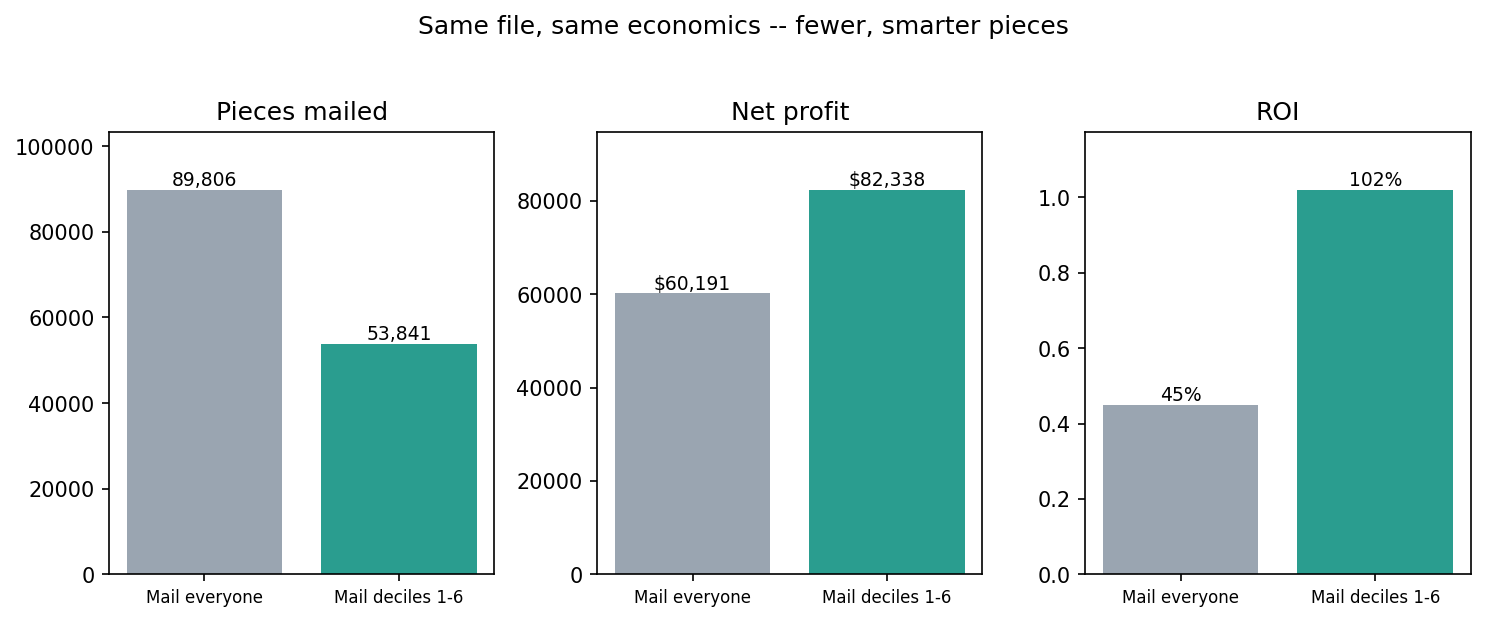 Same file, same economics — fewer, smarter pieces. Click to enlarge.
Decile Detail
| Decile | Pieces | Response | Incremental sales | Net $ | ROI |
|---|---|---|---|---|---|
| 1 | 8,936 | 0.75% | 54.7 | $41,296 | +308% |
| 2 | 8,999 | 0.39% | 28.5 | $15,002 | +111% |
| 3 | 8,987 | 0.39% | 28.5 | $15,020 | +111% |
| 4 | 8,976 | 0.25% | 17.9 | $4,436 | +33% |
| 5 | 8,979 | 0.26% | 18.8 | $5,332 | +40% |
| 6 | 8,964 | 0.20% | 14.7 | $1,254 | +9% |
| — cutoff — | |||||
| 7 | 9,030 | 0.16% | 11.4 | −$2,145 | −16% |
| 8 | 9,004 | 0.13% | 9.8 | −$3,706 | −27% |
| 9 | 8,965 | 0.08% | 5.7 | −$7,748 | −58% |
| 10 | 8,966 | 0.07% | 4.9 | −$8,549 | −64% |
Everything below the line loses money — the model prices out exactly where to stop. Incremental sales are mailed sales minus the sales the holdout shows would have happened anyway.
Technical Implementation
Data generation (01_dgp.py): builds the household universe — a latent affluence factor ties income, net worth, and cruise likelihood together, prior mail responsiveness runs on its own axis — and realizes sales from a hidden logistic propensity, with mail multiplying the odds of a sale ~6x. The intercept is solved numerically so the overall mailed response rate lands at a realistic 0.27%. Seeded with np.random.default_rng, so every figure reproduces exactly.
Modeling (02_model_deciles.py): fits a logistic regression on mailed households only, scores the full file, ranks it into deciles, and builds the decile lift table with holdout-based incremental sales.
Economics (03_roi_report.py): prices each decile (incremental value minus mail cost), finds the breakeven cutoff, and produces the no-model vs. with-model comparison, all charts, and a machine-readable summary.
Honest Limits
- This is a constructed illustration calibrated to realistic direct-mail economics, not a client engagement. The response gradient across deciles was tuned so the breakeven falls mid-file — the interesting case. If the whole file cleared breakeven, the right answer would be “mail everyone.”
- At a 0.27% response rate and ~9,000 mailed households per decile, individual decile counts are inherently noisy — deciles 2 and 3 tie here, and 4 and 5 nearly do. Real programs at this volume should expect the same wobble and judge the cutoff on the dollar picture, not on any single decile’s rate.
- Per-decile holdout groups (~1,000 households) produce only a handful of baseline sales, so decile baselines are estimated by scaling each decile’s mailed rate by the global mailed-vs-holdout lift ratio. The raw holdout counts are kept in the output for inspection.
- The simulation is a single-campaign snapshot. It ignores lifetime value, contact fatigue, and the option of re-mailing top deciles — all of which typically make targeting look better, not worse.